
Towards Supporting Interactive Sketch-Based Visualizations
Description
The goal of the information visualization community is to develop interactive visualizations of abstract data to aid in cognition. While most information visualization research approaches this from a data-driven or a task-driven perspective, our objective is to gain a better understanding of how people already use visuals in their everyday thinking processes and to apply this understanding to create new information visualizations. To this end, we have performed three observational studies: one, looking at the lifecycles of sketches and diagrams used by software developers, another looking at the visual constructs on knowledge workers’ whiteboards, and a third examining how people might interact with a pen-and-touch based system for data exploration using charts. In this paper we group the findings of these three studies to develop a fuller picture of the ways in which people use sketching for visualization tasks.
Images
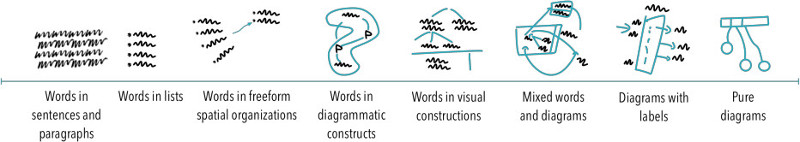
The words-to-diagrams spectrum, with representative examples.
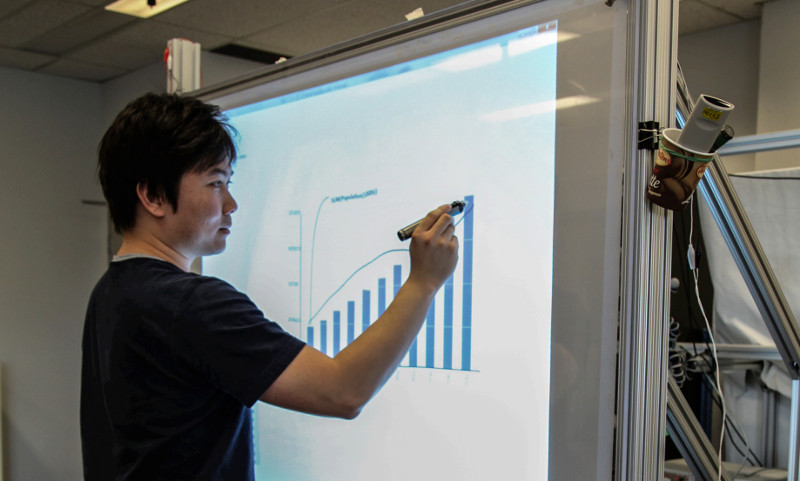
Turning a bar chart into a line chart using the SketchInsight system.